When assessing a company’s valuation, investors rely on multiple financial ratios. One of the simplest yet insightful indicators is the Price-to-Sales Ratio (PSR). This metric compares a firm’s market capitalization with its annual revenue, offering a clear picture of how much the market values each dollar of sales. Unlike earnings-based measures, this approach remains useful even when companies are unprofitable, making it especially relevant for startups and high-growth businesses.
1. Understanding the Ratio
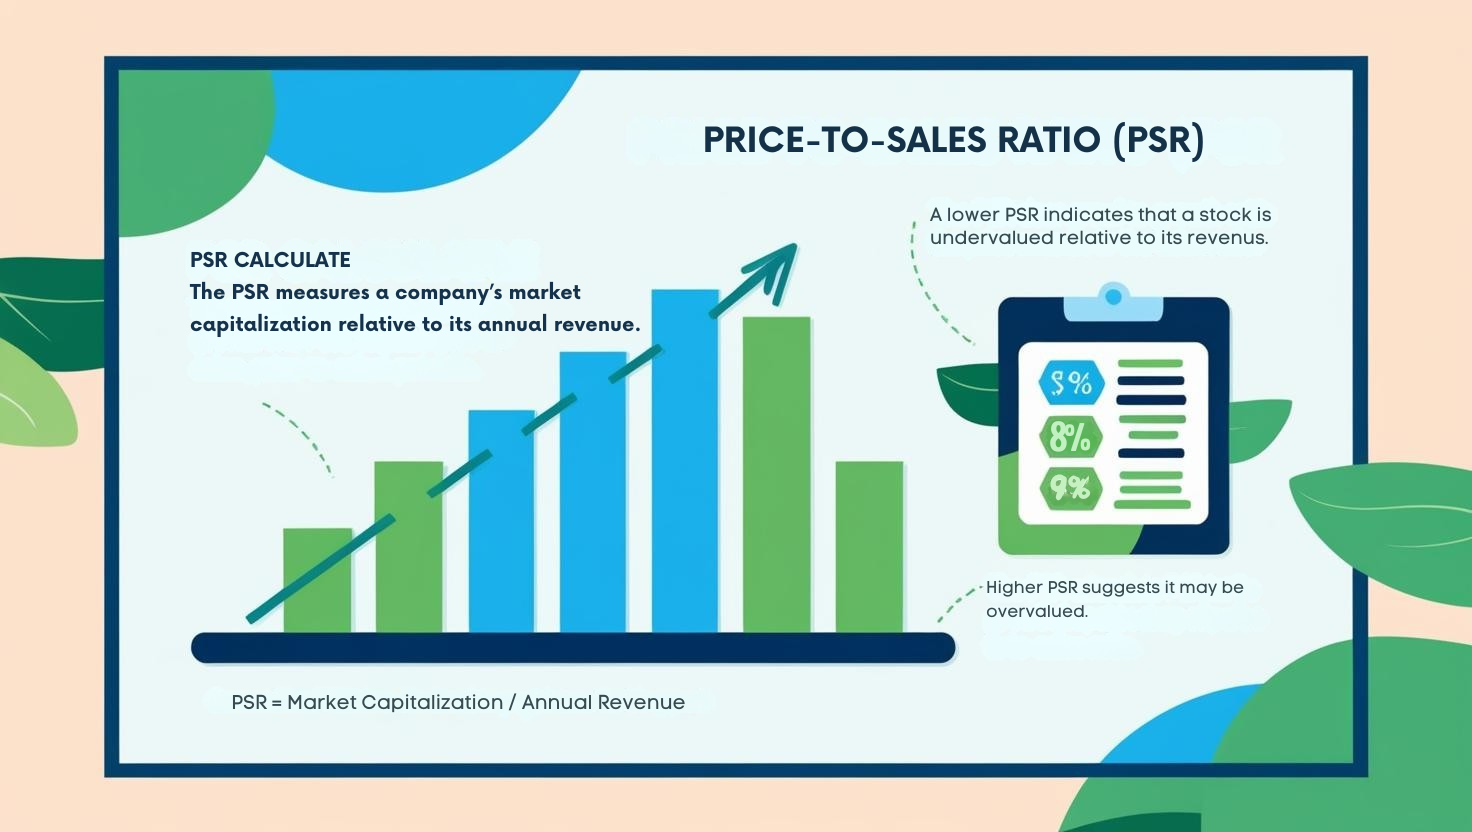
The Price-to-Sales Ratio (PSR) measures a company’s market capitalization relative to its annual sales. Simply put, it shows how high the stock price is compared to the company’s revenue.
PSR Formula:
PSR Formula:
PSR = Market Capitalization Annual Sales
or
PSR = Stock Price Sales per Share
A low ratio often suggests potential undervaluation relative to revenue, while a high figure may imply that investors are paying a premium for future growth expectations.
While the PSR ratio can be a useful tool, investors should avoid relying on it alone when making decisions. For example, some industries naturally generate high sales but low profit margins, meaning a low PSR does not always indicate a bargain. Conversely, companies in emerging sectors may have high PSR values because investors expect rapid growth in the future. Therefore, it is recommended to use PSR together with other valuation metrics, such as the Price-to-Earnings (P/E) ratio or Price-to-Book (P/B) ratio, to gain a more balanced perspective on a company’s true value.
2. Comparing with Other Investment Metrics
It is more effective when used alongside other metrics. Let’s compare it to some popular valuation tools:
(1) PER (Price-to-Earnings Ratio)
- PER: Price divided by earnings per share (EPS), reflecting profitability.
- PSR: Evaluates stock price relative to revenue, even for loss-making companies.
Difference: PER is unsuitable for companies without profits, while PSR can be applied to early-stage or unprofitable growth firms.
(2) PBR (Price-to-Book Ratio)
- PBR: Compares stock price to net asset value, focusing on a company’s balance sheet.
- PSR: Focuses on sales generated from operations.
Difference: PBR is asset-centric, while PSR emphasizes revenue growth potential.
(3) EV/Sales (Enterprise Value to Sales)
- EV/Sales: Enterprise Value (EV) divided by sales, considering total debt.
- PSR: Simpler, using only market capitalization vs. sales.
Difference: EV/Sales is better for assessing overall company value including debt, whereas PSR is ideal for quick revenue-based valuation.
3. Practical Uses
(1) Evaluating Growth Stocks
It is particularly useful for high-growth companies that may not yet generate profits. Tech startups, SaaS platforms, or cloud services often operate at losses initially. PSR allows investors to assess value based on revenue growth.
Example: Amazon maintained a high company valuation for years despite low profitability due to strong sales growth.
(2) Comparing Industry Averages
It can be benchmarked against sector averages:
- Traditional industries (retail, manufacturing): PSR ~0.5–2
- High-growth industries (IT, biotech, cloud): PSR often >5
- Consumer staples (food, utilities): remains moderate and stable
Companies with PSR below the industry average may be relatively undervalued.
(3) Assessing Economic Sensitivity
Tracking PSR over time helps gauge economic sensitivity:
- PSR drops sharply in recessions → cyclical stock
- PSR remains stable → defensive stock
4. Famous Example
Ken Fisher, author of Super Stocks, is a notable PSR proponent. His strategy:
- PSR ≤ 1 → undervalued growth stock
- PSR ≤ 0.75 → highly undervalued
- PSR ≥ 3 → overvalued, exercise caution
Fisher identifies “super stocks” with low PSR and high growth potential.
5. Key Considerations
- Profitability: Low PSR does not guarantee a good investment; assess profit margins.
- Industry Differences: Benchmark against sector averages for context.
- Qualitative Growth: Examine how revenue is generated; avoid short-term spikes from aggressive discounts or excessive marketing.
- Debt Levels: PSR ignores debt; complement with EV/Sales for comprehensive evaluation.
6. Conclusion
The Price-to-Sales Ratio is a straightforward yet versatile valuation tool. Used wisely in combination with PER, PBR, and EV/Sales, it helps investors identify promising opportunities in both established sectors and innovative growth industries. For long-term success, balance this metric with a broader evaluation of profitability, financial stability, and market potential.
Further Reading:
Investopedia: Price-to-Sales Ratio
Internal Link: Understanding PER and PBR for Stock Valuation