The Moving Average (MA) is one of the most widely used indicators in technical analysis. It helps traders identify trends, filter out market noise, and make more informed decisions. By calculating the average of price data over time, moving averages smooth short-term volatility and highlight long-term trends.
The Basics of Moving Averages
A moving average calculates the average price over a set period and plots it as a line. For example, a 20-day MA sums the closing prices of the past 20 days and divides by 20. As new data comes in, the oldest data is removed, which is why it is called “moving.”
Key purposes of moving averages:
- Reduce market noise
- Identify trend direction
- Provide potential support and resistance levels
- Generate buy and sell signals
Main Types of Moving Averages
1. Simple Moving Average (SMA)
The SMA gives equal weight to all prices in the period:
SMA = (P₁ + P₂ + … + Pₙ) / n
Disadvantages: Reacts slowly to recent price changes since all data points are equally weighted
Advantages: Simple and easy to understand
2. Exponential Moving Average (EMA)
The EMA gives more weight to recent prices, making it more responsive:
EMA (Exponential Moving Average)
EMA = Current Price × k + Previous EMA × (1 – k)
where k = 2 / (period + 1)
Advantages: Reacts quickly to recent price movements
Disadvantages: Can be more sensitive to short-term volatility
3. Weighted Moving Average (WMA)
The WMA assigns linearly decreasing weights to older data:
WMA (Weighted Moving Average)
WMA (Weighted Moving Average)
WMA = (P1 × n + P2 × (n-1) + … + Pn × 1) / (n + (n-1) + … + 1)
Advantages: Smooth line, more responsive than SMA
Disadvantages: More complex to calculate
Common Periods for Moving Averages
Traders use different MA periods depending on the timeframe:
- Short-term: 5, 10, 20 days – identify short-term trends
- Medium-term: 50, 100 days – identify intermediate trends
- Long-term: 200 days – identify long-term trends
The 200-day SMA is especially important for signals like the Golden Cross and Death Cross.ross.
Trading Strategies Using Moving Averages
1. Trend Identification
- Price above the MA → Uptrend
- Price below the MA → Downtrend
- Slope indicates trend strength
2. Crossover Strategy
Use two MAs (e.g., 50-day and 200-day) to generate signals:
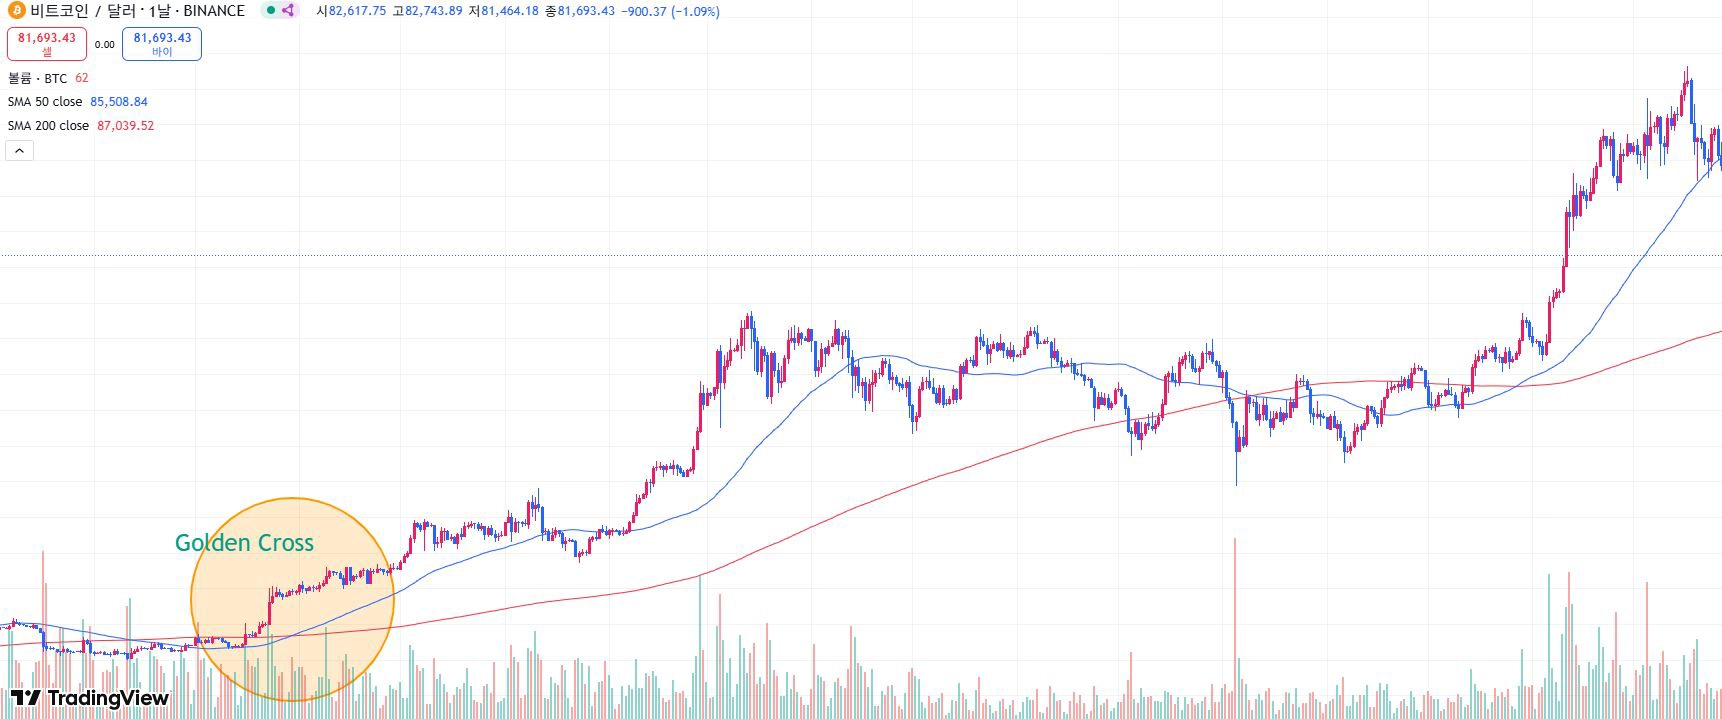
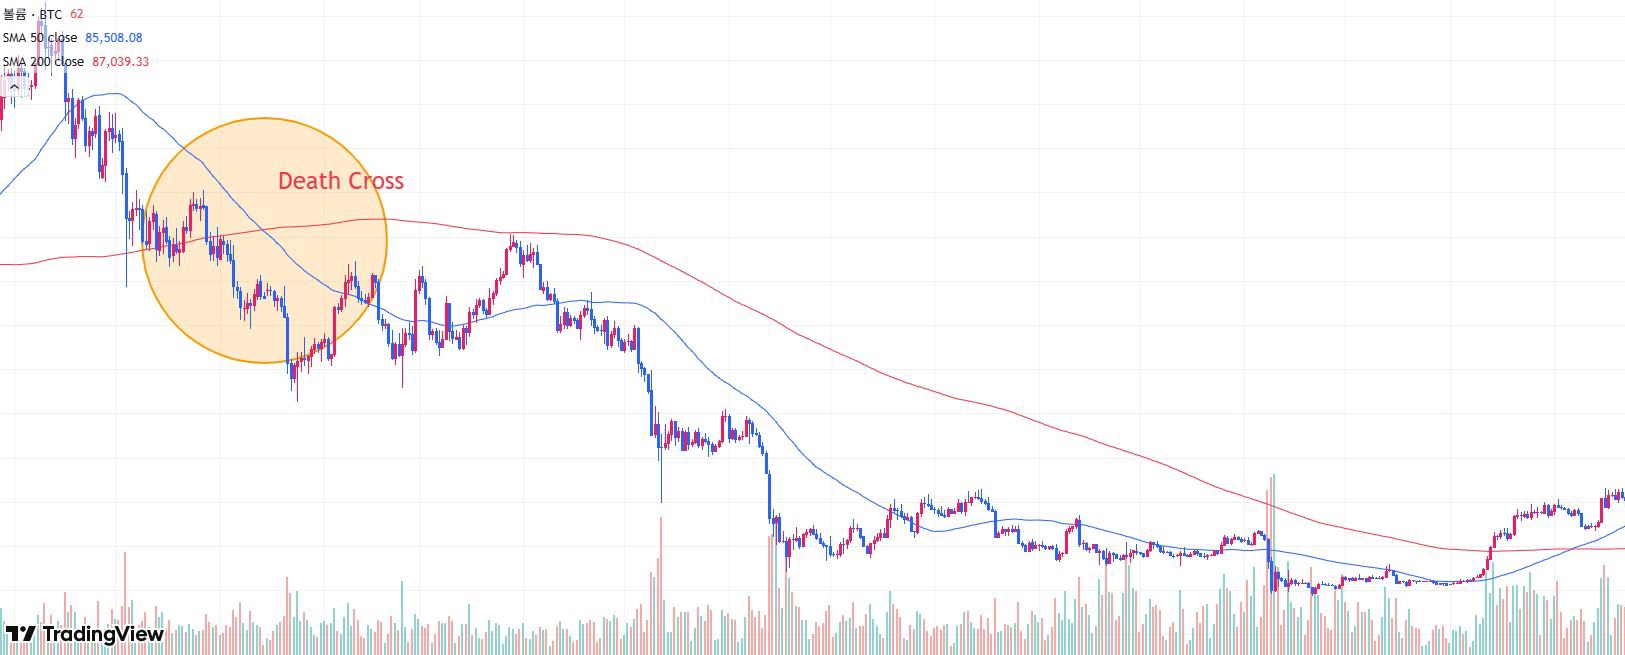
- Golden Cross: Short-term MA crosses above long-term MA → Buy signal
- Death Cross: Short-term MA crosses below long-term MA → Sell signal
The chart below is a daily chart of Bitcoin/USD, showing a prolonged uptrend following the Golden Cross, which is the intersection of the 50-day moving average (blue line) and the 200-day moving average (red line).
The chart below also shows a Bitcoin/USD daily chart, showing a prolonged downtrend following the Death Cross, where the short-term moving average (50-day – blue) broke below the long-term moving average (200-day – red).
3. Support and Resistance
Key MAs (50, 100, 200 days) often act as support/resistance levels where prices may bounce or face resistance.
4. Multiple Moving Average System
Using 3+ MAs (e.g., 20, 50, 200 days) helps analyze trends across multiple timeframes and generate refined trading signals.
Tips and Considerations
- Lagging Indicator: MAs are based on past prices; EMA is faster than SMA but still lagging.
- Sideways Markets: MAs perform best in trending markets; false signals may occur in sideways markets.
- Optimal Periods: The best MA periods depend on trading style, timeframe, and asset type. Test and adjust accordingly.
- Combine with Other Indicators: Use MA with RSI, MACD, or Stochastic for stronger signals.
Conclusion
Moving averages are a simple yet powerful tool for traders of all levels. They help reduce noise, identify trends, and provide actionable insights. To maximize effectiveness:
- Understand the basic principles
- Experiment with different settings
- Combine with other analysis tools
- Adapt to market conditions and personal trading style
Whether you are a beginner or an expert, moving averages can add significant value to your trading toolkit.