The Relative Strength Index (RSI) is a powerful oscillator used in technical analysis to measure market momentum and identify overbought or oversold conditions. Developed by J. Welles Wilder Jr. in 1978, RSI helps traders predict potential price reversals and optimize trading strategies for stocks, Forex, and cryptocurrencies.
1. What is RSI (Relative Strength Index)?
RSI is an oscillator ranging from 0 to 100 that indicates whether a market is overbought or oversold. Traders use it to generate buy or sell signals based on price momentum.
- Learn more about RSI on Investopedia: Relative Strength Index (RSI)
- Also check out my other post: “Beginner’s Guide to Technical Indicators”
2. How RSI Is Calculated
RSI is calculated using the following formula:
$$ RSI = 100 – \frac{100}{1 + RS} $$where RS (Relative Strength) is defined as the ratio of average gains to average losses:
$$ RS = \frac{\text{Average Gain}}{\text{Average Loss}} $$Calculation Steps:
- Set the period NNN (typically 14 days).
- Separate the days into up days and down days.
- Calculate the average gain on up days and average loss on down days.
- Compute the RS value and apply the RSI formula to get the final RSI.
- For a detailed RSI calculation tutorial, see TradingView RSI Guide
- For more information: “How to Read Candlestick Patterns”
3. Key Interpretation Levels
RSI values range from 0 to 100 and are generally interpreted as follows:
1) Overbought Zone (RSI ≥ 70)
- Indicates that prices may have risen too much.
- Potential downward reversal may follow.
- In strong uptrends, RSI can remain above 70 for an extended period.
- Tip: Confirm sell signals with other indicators.
2) Oversold Zone (RSI ≤ 30)
- Indicates that prices may have dropped too much.
- Potential upward reversal may follow.
- In strong downtrends, RSI can stay below 30 for long periods.
- Tip: Look for confirmation before buying.
3) Neutral Line (RSI 50)
- RSI > 50 indicates an uptrend.
- RSI < 50 indicates a downtrend.
- Crossing 50 can signal further momentum in the respective direction.
4. RSI Applications
1) Divergence
Divergence occurs when price and RSI move in opposite directions.
Bullish Divergence
- Price forms a new low, but RSI rises.
- Interpreted as a buy signal.
- Reliability increases if RSI crosses above 50 after the divergence.
Bearish Divergence
- Price forms a new high, but RSI declines.
- Interpreted as a sell signal.
- Reliability increases if RSI falls below 50 after the divergence.
2) Adjusting RSI Periods
| Period | Signal Frequency | Use Case |
|---|---|---|
| ≤7 days | High (sensitive) | Short-term trading |
| 14 days | Standard | Most commonly used |
| ≥21 days | Low (reliable) | Long-term trend analysis |
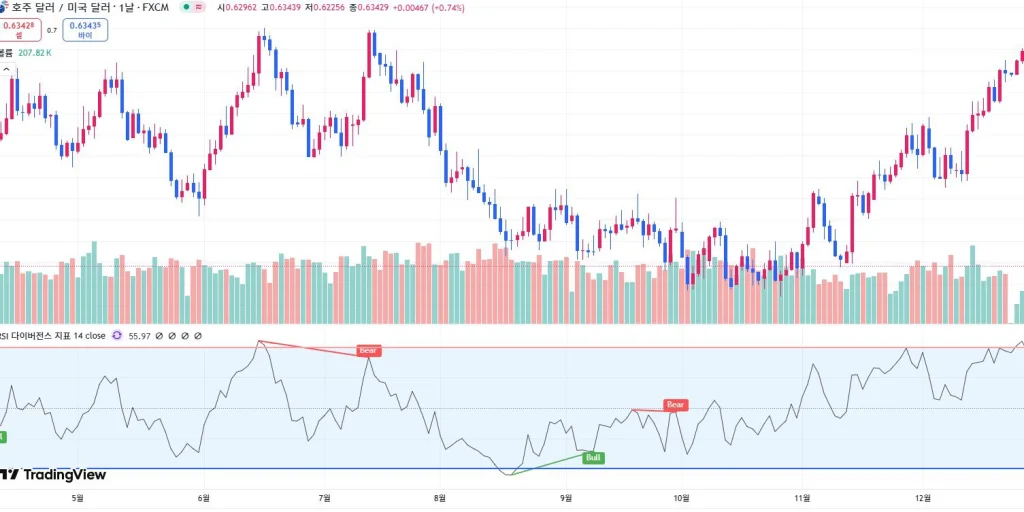
Image source: Tradingview.com
The above chart (AUD/USD daily) shows that after the first bearish divergence, the price continues to fall. However, after the next bullish divergence, the price does not rise immediately, but declines once more before moving upward.
5. Limitations of RSI
- False signals in ranging markets: RSI signals may become frequent in a horizontal trading range.
- Inefficiency in trending markets: In strong trends, overbought/oversold conditions can persist.
- Need for confirmation: Best used in combination with other indicators like MACD or moving averages.
- Compare different periods: Analyzing short-term (5-day) and long-term (14-day) RSI together can improve decision-making.
6. Practical Examples
1) Buy Signal in Oversold Zone
- RSI below 30 can indicate a buying opportunity.
- If RSI crosses above 30, upward momentum may follow.
- Confirming with increased trading volume improves reliability.
2) Sell Signal in Overbought Zone
- RSI above 70 can indicate a sell signal.
- A drop below 70 may signal a downward reversal.
- Checking previous resistance levels can help determine a more accurate selling point.
3) Bullish Divergence
- Indicates weakening selling pressure and potential upward reversal.
- RSI crossing above 50 after divergence increases reliability.
4) Bearish Divergence
- Indicates weakening buying pressure and potential downward reversal.
- RSI falling below 50 after divergence increases reliability.
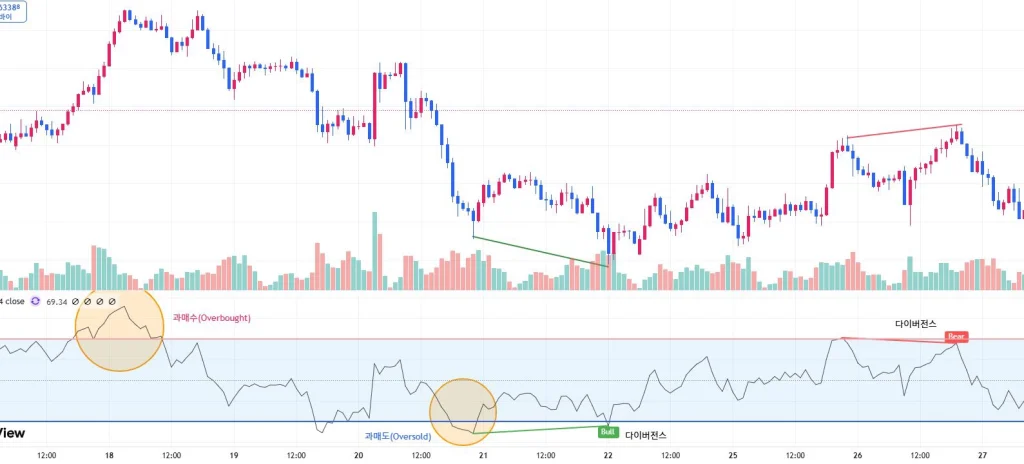
Image source: Tradingview.com
When the first overbought condition drops below 70, it signals preparation for selling. After entering an oversold zone (RSI < 30) and observing a bullish divergence, it signals a buying opportunity. In the chart, after a small rise following a bullish divergence, another bearish divergence appears, suggesting preparing to sell or close positions again.
7. Conclusion
RSI is a simple yet powerful technical indicator widely used by beginners and professional traders. For best results:
- Combine RSI with other indicators for confirmation.
- Adjust RSI thresholds (30/70) according to market conditions.
- Analyze multiple timeframes for better decision-making.
Learn more about RSI strategies: BabyPips RSI Trading Guide
Check out my other post: “Beginner’s Guide to Forex Trading”