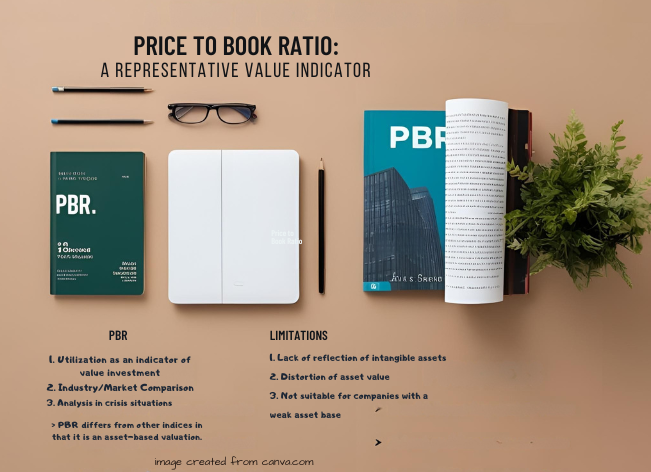
Price-to-Book Ratio (PBR) is one of the most widely used value indicators in fundamental analysis. It helps investors determine whether a stock is undervalued or overvalued compared to the company’s net assets (equity).
The basic formula is:
PBR = Stock Price / Book Value Per Share (BPS)Where:
BPS = (Shareholders’ Equity – Preferred Equity) / Total Outstanding SharesFor example, if Company A’s stock is trading at $50.00 and its BPS is $25.00, then the PBR is 2.0. This means the market is valuing the company at twice its actual book value.
1. Interpreting PBR
- PBR < 1 (Undervalued)
Market values the company below its actual assets.
Example: PBR 0.7 → assets worth $100 are valued at $70 by the market. - PBR ≈ 1 (Fair Value)
Stock price closely reflects book value. - PBR > 1 (Overvalued)
Market prices in brand value, future growth, or profitability. Common in technology and growth stocks.
2. Comparing PBR with Other Financial Ratios
| Ratio | Formula | Focus | Strength | Weakness |
|---|---|---|---|---|
| PBR | Price / BPS | Asset-based valuation | Stability measure | Ignores intangible assets |
| PER | Price / EPS | Profit-based | Earnings focus | Distorted by temporary profit changes |
| PSR | Market Cap / Sales | Sales-based | Useful for startups | Ignores profitability |
| EV/EBITDA | Enterprise Value / EBITDA | Cash flow | Independent of capital structure | Complex calculation |
| ROE | Net Income / Equity | Return efficiency | Profitability measure | Sensitive to leverage |
👉 Unlike PER, which emphasizes earnings, this ratio highlights tangible asset value, making a combination of metrics more comprehensive.
3. PBR vs PEG
| Factor | PBR | PEG |
|---|---|---|
| Focus | Asset value | Growth rate |
| Common Use | Manufacturing, Finance, Real Estate | Technology, Biotech, IT |
| Undervaluation | PBR < 1 | PEG < 1 |
| Limitation | Ignores intangibles | Growth forecasts can be wrong |
4. Using PBR & PEG Together
- Case 1: Low PBR + Low PEG → Attractive value + growth
- Case 2: High PBR + High PEG → Overheated, high risk
5. Practical Uses of PBR
- Value Investing: Investors like Warren Buffett and Benjamin Graham identify undervalued companies using this ratio combined with ROE.
- Industry Comparison: In asset-heavy sectors such as banking or insurance, the metric serves as a core valuation tool.
- Crisis Analysis: During recessions, a drop below 0.5 may indicate bargain opportunities relative to intrinsic asset value.
6. PBR in Modern Market Analysis
In today’s fast-changing markets, this valuation metric helps not only traditional investors but also those analyzing sector-specific trends. For instance, asset-intensive industries like banking, insurance, and real estate benefit from PBR as it identifies companies trading below intrinsic value. In contrast, for technology, biotech, and service sectors, interpretation should include intangibles, intellectual property, and growth potential, since these businesses often have high ratios despite limited physical assets. Combining this ratio with trend analysis, sector comparisons, and macroeconomic indicators allows investors to spot opportunities during market cycles, such as post-recession recoveries or sector rotations.
7. Integrating PBR with ESG Factors
Investors increasingly incorporate ESG (Environmental, Social, Governance) criteria into decision-making. While this ratio evaluates financial stability, combining it with ESG performance provides a broader perspective on long-term value. A company with a low ratio and strong ESG ratings may be financially undervalued and demonstrate sustainable practices, low regulatory risk, and social responsibility. Conversely, a company with a low ratio but weak ESG scores could carry hidden risks affecting future asset value. Integrating ESG analysis with this financial metric aligns investment decisions with sustainability and ethical considerations—critical in 2025’s global investing landscape.
8. Limitations of PBR
- Doesn’t reflect intangible assets (brands, patents, human capital).
- Book value may differ from market value of assets.
- Less useful for tech or service companies with minimal physical assets.
9. Strategic Investment Tips with PBR
- Golden Combo for Value Investors:
- PBR < 1 + ROE > 10% = Strong undervalued candidate.
- Caution Signal:
- PBR > 3 + Low ROE = Possible overvaluation risk.
- Industry-Specific Use:
- Manufacturing/Finance → PBR + ROE.
- Growth Tech → PER + PEG (referencing this ratio).
10. Conclusion: PBR as the Compass of Value Investing
This ratio remains a key tool for evaluating financial stability and spotting undervaluation. While it shouldn’t be used alone, combining it with PER, ROE, and PEG gives a more complete picture for long-term investors.
At its core, it reinforces the timeless principle:
👉 Buy low, sell high.
It helps investors spot opportunities when markets are irrational, making it a true compass for value investing.
🔗 Internal & External Resources
Investopedia: Price-to-Book Ratio Explained
In our other article: Why Invest in U.S. Stocks?


