When investing in U.S. stocks, you often encounter the Price-to-Earnings (P/E) ratio. However, relying solely on the P/E ratio may not fully reflect a company’s growth potential. This is where the PEG ratio (Price/Earnings to Growth Ratio) comes in. In this article, we will explore the PEG ratio, its uses, and what to watch out for when evaluating growth stocks.
1. What is the PEG Ratio (Price/Earnings to Growth Ratio)?
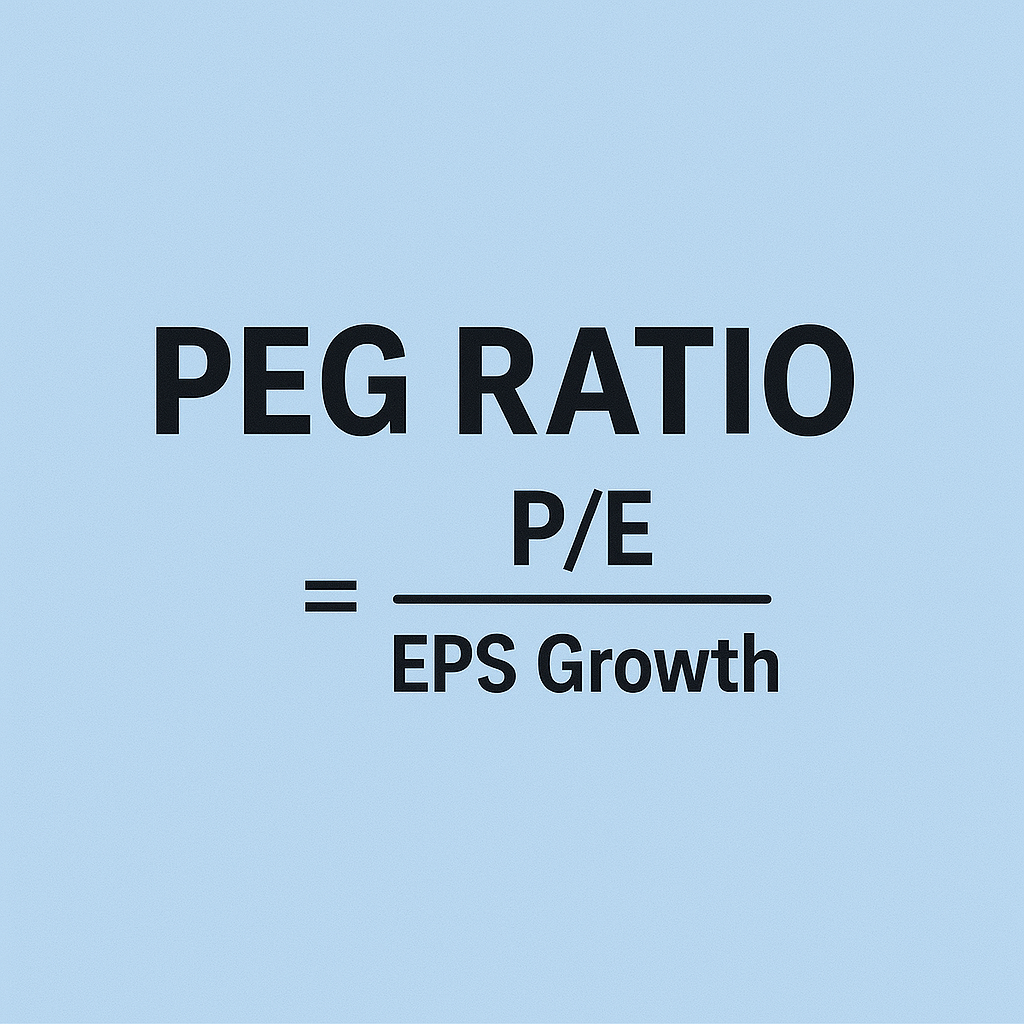
The Price/Earnings to Grow ratio is calculated by dividing the P/E ratio by the annual expected earnings growth rate (EPS growth rate).
The formula is:
PEG Ratio Formula
P/E EPS Growth Rate
Where:
- P/E (Price-to-Earnings Ratio): Stock price divided by earnings per share (EPS)
- EPS Growth Rate: Expected annual growth rate of earnings per share (%)
Using the ratio allows investors to evaluate a company while considering its growth potential, providing a more complete picture than the P/E ratio alone.
History of the PEG Ratio
The PEG ratio was popularized by famous investor Peter Lynch, a legendary growth stock investor. Lynch emphasized evaluating companies not just by their current P/E ratio, but by their future growth potential. He focused on finding companies with a low PEG within the same industry, indicating relative undervaluation. However, he also cautioned that a low PEG does not guarantee a good investment if the company’s fundamentals are weak. Lynch achieved notable success by investing in retail and consumer goods companies with favorable PEG ratios, highlighting the importance of the ratio in growth stock investing.
2. How to Interpret
The PEG ratio is generally interpreted as follows:
- PEG < 1: Likely undervalued
- PEG = 1: Fair value
- PEG > 1: Possibly overvalued
Below 1 indicates the stock price may be low relative to its earnings growth, while above 1 suggests the stock may be high compared to its growth rate.
3. Calculation Examples
Example 1: Evaluating a Growth Stock
Consider Tesla (TSLA):
- Current price: $300
- EPS: $10
- Expected EPS growth: 25%
PEG Ratio Calculation Example
Step 1: Calculate P/E Ratio
| 300 |
| 10 |
= 30
Step 2: Calculate PEG Ratio
| 30 |
| 25 |
= 1.2
Or equivalently:
| 25 |
| 30 |
= 1.2
Tesla’s PEG ratio of 1.2 suggests it may be slightly overvalued, but the company’s high growth potential could still make it a worthwhile investment.
Example 2: Evaluating a Value Stock
Consider Coca-Cola (KO):
- Current price: $60
- EPS: $3
- Expected EPS growth: 5%
PEG Ratio Calculation Example: Coca-Cola (KO)
Step 1: Calculate P/E Ratio
| 60 |
| 3 |
= 20
Step 2: Calculate PEG Ratio
| 20 |
| 5 |
= 4.0
Or equivalently:
| 5 |
| 20 |
= 4.0
Coca-Cola’s PEG ratio of 4.0 indicates the stock is expensive relative to its growth rate, though it may still be attractive as a stable dividend stock.
4. PEG Ratio vs. Shiller P/E Ratio
Another commonly used metric is the Shiller P/E Ratio. Key differences:
| Metric | Calculation | Feature | Purpose |
|---|---|---|---|
| PEG Ratio | P/E ÷ Expected EPS Growth | Reflects future growth | Evaluates individual company undervaluation |
| Shiller P/E | Price ÷ (10-year average real EPS) | Accounts for economic cycles | Evaluates overall market or long-term valuation |
While the Shiller P/E uses a 10-year EPS average for long-term market evaluation, the PEG ratio focuses on individual company growth. Thus, PEG is ideal for analyzing high-growth companies, whereas Shiller P/E is mainly for assessing market bubbles.
5. Advantages and Limitations
Advantages
✅ Considers growth: Reflects company growth better than the P/E ratio
✅ Identifies over/undervaluation: PEG < 1 indicates potential undervaluation
✅ Useful for growth stock analysis: Effective for high-growth tech or emerging companies
Limitations
⚠ EPS growth prediction: Forecasted growth may be inaccurate
⚠ Unsuitable for cyclical industries: PEG can be distorted by economic fluctuations
⚠ High-growth companies: Early-stage innovators may appear undervalued due to extremely high growth
6. Strategies for Using the Ratio
- Finding undervalued growth stocks
Look for companies with PEG < 1. High growth but low PEG indicates possible undervaluation. - Industry comparison
Use PEG to compare companies within the same sector. For example, compare Apple (AAPL) and Microsoft (MSFT) to evaluate relative attractiveness. - Combine with other metrics
PEG should be used alongside ROE, debt ratios, and other financial indicators for a comprehensive evaluation.
7. Conclusion
The PEG ratio is a powerful tool that allows for more precise evaluation of a company’s value compared to the P/E ratio. However, its limitations mean investors should verify the reliability of EPS growth estimates and use it alongside other metrics. For those considering growth stock investing, the PEG ratio is an essential metric to incorporate into your analysis toolkit.
Check out more:


