When you invest in the stock market, you encounter many financial indicators. Among them, earnings per share (EPS) is one of the most fundamental and critical concepts. EPS measures a company’s profitability per share and is a must-check figure for investors evaluating the value of a stock.
In this article, we’ll cover what EPS is, how it’s calculated, why it matters, the different types, its relationship with the P/E ratio, its limitations, and how to use it effectively in your investment strategy.
Learn more about the basics of Earnings Per Share (Investopedia).
1. What is EPS (Earnings Per Share)?
Earnings per share represents the portion of a company’s net income allocated to each outstanding share. In simple terms, it tells you how much profit a company generates for every share of stock.
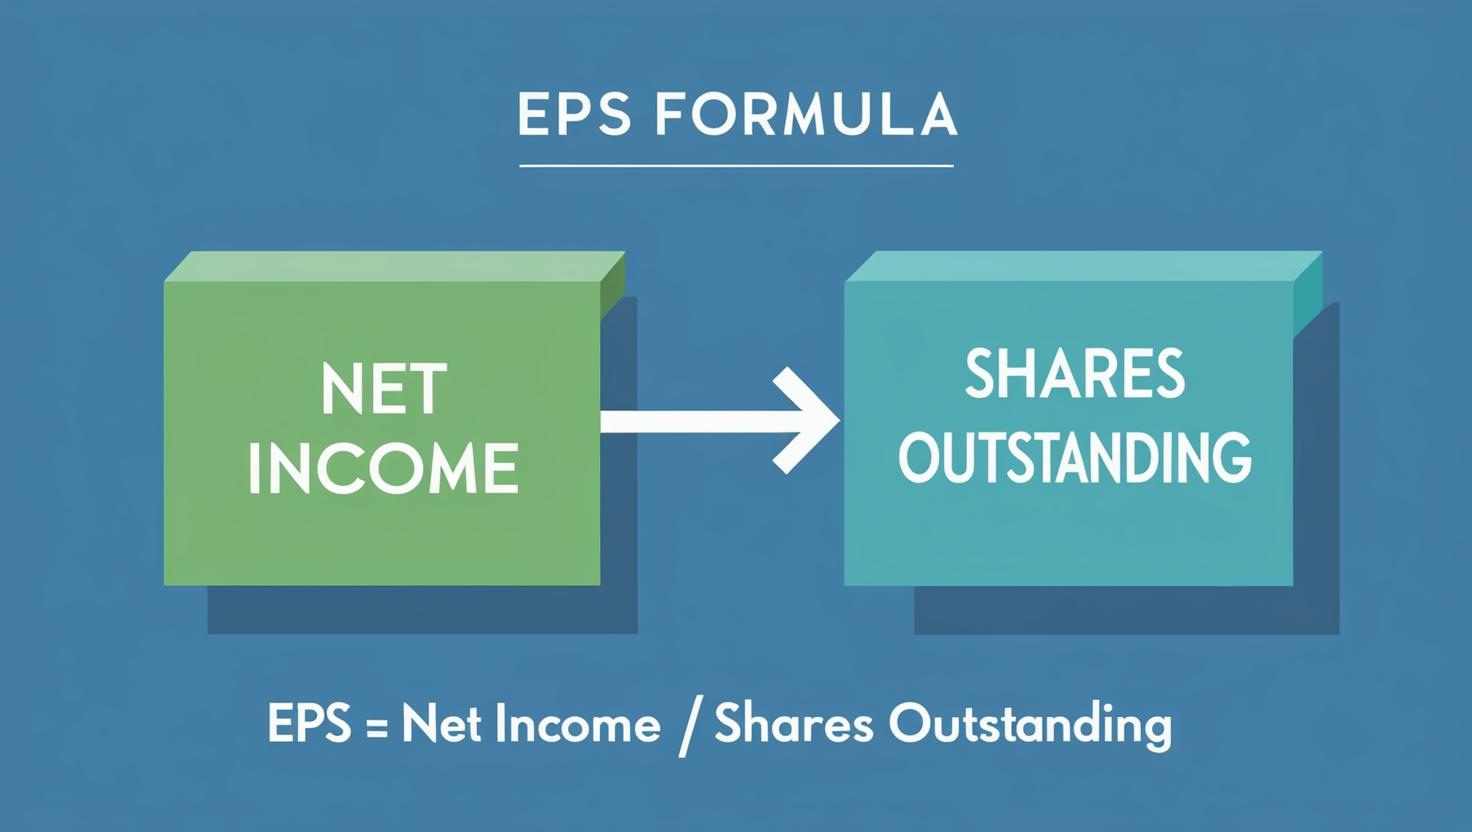
Formula
Net Income Shares Outstanding = EPS
Example
If a company earns $1,000,000,000 in net income and has 100,000,000 shares outstanding, the EPS is:
1,000,000,000 100,000,000 = $10.00
This means the company generates $10.00 profit per share.
2. Why It Matters
This profitability measure is one of the most widely used in investment analysis because:
- Profitability Check: A higher figure shows the company is generating strong profits.
- Valuation Measure: It’s a key component of the P/E ratio, which helps investors determine if a stock is overpriced or undervalued.
- Dividend Potential: Firms with consistently strong per-share earnings often have greater capacity to pay dividends.
For a deeper dive into P/E ratios and valuation, check out our guide: Understanding the P/E Ratio.
3. Types of Earnings per Share
- Basic EPS: Standard calculation (Net income ÷ Shares outstanding).
- Diluted EPS: Considers convertible securities (options, bonds) that could increase share count.
- Adjusted EPS: Excludes one-time costs or extraordinary items to reflect ongoing profitability.
4. Link Between Earnings and P/E Ratio
Earnings per share (EPS) is directly linked to the Price-to-Earnings Ratio (PER/P/E), which is one of the most widely used indicators in stock investing. The P/E ratio measures how much investors are willing to pay for each dollar of a company’s profit. In other words, it shows the market’s expectations for the company’s future growth relative to its current earnings.
P/E Ratio (Price-to-Earnings) in USD:
Stock Price Earnings per Share = P/E
Example:
$100 $10 = 10
This means investors are willing to pay 10 times the company’s earnings for each share.
- ✅ High P/E: The market expects strong future growth. A high P/E is common for companies in high-growth industries, like technology, because investors anticipate profits to increase significantly in the coming years.
- ✅ Low P/E: Could indicate undervaluation or that the company may have weaker growth prospects. It may also suggest a stable, slower-growing company that investors consider safer but less exciting.
By looking at the P/E ratio together with EPS, investors can assess whether a stock is fairly valued, overpriced, or potentially undervalued relative to its earnings. This is particularly useful when comparing companies within the same industry.
👉 For further guidance, see our related article: PEG Ratio Explained: How to Properly Evaluate Growth Stocks to understand how EPS ties into growth-adjusted valuation.
5. Investment Strategies Using EPS
- Growth Analysis: Companies with steadily increasing per-share profits are strong candidates for long-term growth investing.
- Companies with steadily increasing EPS are strong candidates for long-term growth investing.
- High CAGR (Compound Annual Growth Rate) of EPS often signals a growth stock.
- P/E Combination: A high profit-per-share with a very high P/E may signal overvaluation, while the reverse may highlight undervalued opportunities.
- Dividend Focus: Stable and strong earnings often mean sustainable or rising dividends.
- Stable, high EPS suggests a company can sustain or increase dividends.
- Combine EPS with payout ratio to assess dividend strength.
6. Limitations
- Accounting Manipulation: Companies may adjust accounting rules to inflate EPS.
- Ignores Debt Levels: High profits per share don’t show risky leverage.
- Cross-Industry Comparisons: Best compared within the same sector; comparing across different industries can be misleading.
7. Understanding and Using EPS Wisely
Earnings per share is a cornerstone metric in stock investing. It offers valuable insights into profitability but should be paired with other measures like ROE, debt ratios, and P/E.
Companies with rising per-share earnings often present long-term opportunities, whether you focus on growth stocks or dividend plays. Always consider financial structure and industry context before investing.
By understanding this metric thoroughly, you can make smarter, more confident investment choices.


